When it comes to MuleSoft™ code quality analysis, IZ Analyzer is an outright choice among the Developer community. At Integral Zone, our R&D team is constantly working on releasing new features that will make our users’ lives easier. This time it is a big update!
For starters, IZ Analyzer is a feature rich product for Code quality assessment(CQA) for APIs and comes with an array of possibilities.
- It comes bundled with over 200 predefined rules to validate MuleSoft projects.
- One can create custom rules in addition to the default ones.
- Also, it can scan popular non-mule API specifications like OAS.
- Moreover, IZ Analyzer can also be configured with an organization’s DevOps process, supporting all major platforms like Azure, Jenkins, etc.
This blog is focused on the Anypoint Studio plug-in for IZ Analyzer. Would you like to know how IZ Analyzer integrates with Anypoint Studio so that MuleSoft developers can check their code for potential violations during development? All that with a single click!
Let me walk you through how to setup IZ Analyzer in Anypoint Studio. As soon as that is done, we will import a Mule project template into Anypoint Studio. MuleSoft’s official training project apdev-flights-ws will be used for demonstration purposes. As we explore different aspects of IZ Analyzer, we will be able to:
- Inspect how the on-the-fly palette displays and flags the rule violations
- Check other tabs like rule description, auto-fix logs etc.
- Test the newly launched AutoFix feature and its Preview button, fix a few complex rules.
Let’s get started.
Setting Up Anypoint Studio
IZ Analyzer can be set up by signing into the product registration here. After registering and obtaining the security key, Anypoint Studio can be configured.
Anypoint Studio configuration of the product is also fairly simple. For a step by step guide of the same kindly follow our documentation on this link. Once the product registration and configuration in the studio is complete, we are all set to launch IZ Analyzer.
Importing Mule Project, Scanning for CQA Violations
- Step 1: Upon launch, import the MuleSoft project in the studio.

- Step 2: When the project is imported, you can see the complete set of rule violations mapped to the error categories.

- Step 3: Double click on any of the error description to see rule description view. Notice the description.

- Recommended step: Explore the custom rule editor view. Explore other views like AutoFix Logs, Rule Description etc.

During the walkthrough, we have completed the Anypoint Studio setup. We had imported a Mule project as well as configured IZ Analyzer in our studio. In the following sections, let us explore how the latest AutoFix feature can help Mule developers attain highest code quality early in SDLC. AutoFix feature also introduces a nifty ‘Preview’ button, to preview the changes about to happen.
To start, let me list out the routine development process;
– Developer completes development.
– Code is committed to the repo, Dev build is deployed.
– IUT tests executed, issues identified and resolved.
– Once IUT is done code is pushed to UAT.
– UAT tests are executed, issues are identified, reported and resolved.
– Code is ready for pre-prod and sent to the Architect or Lead for review.
– Potential CQA violations are identified and shared for rectification.
– In pre-prod deployment builds, embedded CQA are executed.
One point to note is that some of these steps may vary depending on the organization’s philosophy. It could be in different ways for different people. However CQA is generally executed in the later stages of the entire life cycle and in case of an anomaly, developer has to generally go back to the drawing board to rectify.
What stands out in IZ Analyzer with the latest feature is that the Developer will assess the code, right in his/her respective studio. Code compliance becomes quick & efficient as you can comply the code to the code quality profiles. Developers can preview the fix that will be applied with the preview button. Now, Code violations are fixed with the mere click of a button. Imagine how many hours you could save by reducing your technical debt.
Now let’s dig a little deeper. Let’s see some code violations. We will start with this one.
- API Implementation should not be in auto generated file


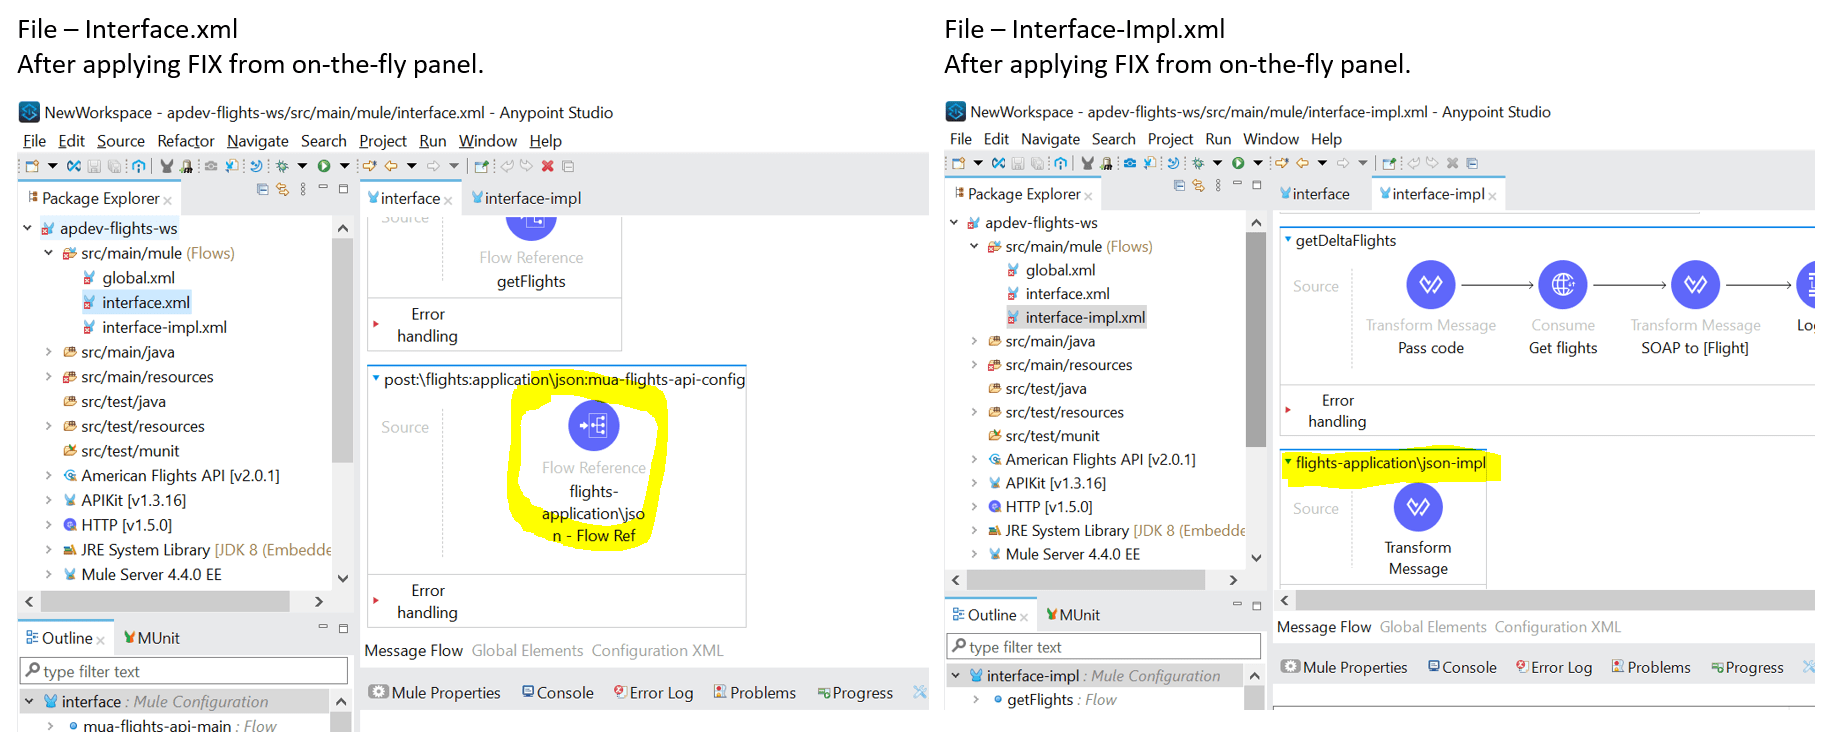
Notice how post fix new flow ref is generated. Also notice how in imple.xml new flow implementation is auto generated and is referred from interface.xml. All this on mere button click!
We will see one more code quality rule which is non externalization of properties. Ideally a good MuleSoft project would have connector configurations in config files. For instance in HTTP Listener config, the best practice is to keep all config in a property file. But what if during development the hostname or port are not externalized or what if you have legacy projects which are not aligned to best practices?

Click on preview button to see as a part of fix for externalization of Hostname and Port, what changes will be done to the code.
When you click fix, see how respective configs are externalized and generated to be referred from the HTTP Listener config. Refer below picture.

IZ Analyzer – AutoFix Logs
IZ Analyzer’s AutoFix and Preview features are fascinating.
While you can align all code quality anomalies with the click of a button to best practices, one may forget to track what all changes were done as a part of this exercise. There can be situations in which there are quite a few fixes, and a report or analysis is required.


Endnotes
IZ Analyzer, which is already used by clients from multiple industries, saves about 80% of costs and time on MuleSoft projects. From our research, most of the MuleSoft customers appear to be following either manual code reviews or rudimentary automation where errors are inherent.
IZ Analyzer’s Anypoint Studio plugin, especially with its latest Preview and AutoFix features, simply takes MuleSoft CQA to the next level making it easy, faster and simply hassle free. IZ Analyzer’s 450+ predefined rules ensure that best practices are never compromised, plus the ability to create additional custom rules allows the Customers to implement their organization specific rules. Overall, our customers recover the licensing cost of IZ Analyzer within first 2 months of using the product.
Let us know what you think, feel free to drop a comment.
Start using IZ Analyzer for Free
Interested in trying out the most powerful MuleSoft code review tool in the Mule Ecosystem? Try now our free Online scanner and get your scan results instantly.
There’s more to it. If you would like to see the product in action, book an online demo.
Feel free to leave a reply or query.
Mulesoft™ is a unified, single solution for iPaaS and full lifecycle API management. For further information, please visit www.mulesoft.com.
Discover more from Integral Zone
Subscribe to get the latest posts sent to your email.


